



New features in Sellizer #17 - Heatmap and Session replay: see how a client reads your proposal

What is a heatmap?
Before we get to the new features - a quick explanation for anyone who hasn't come across heatmaps yet.
A heatmap is a visual representation of where the viewer's attention was focused. Instead of dry numbers, you see colors laid directly over the proposal: the longer a client lingered on a given fragment with their mouse, the warmer the color. Barely noticed spots stay cool (blue), while the ones that genuinely caught their interest glow red.
What does this change in practice?
Until now, statistics told you that a client spent quite a bit of time on a given page. Now the Heatmap will show you that they focused their attention on the table with the scope of services and completely skipped the section about your company. That's a huge difference, because:
You see not only how much time the client spent on the page, but what specifically caught their eye.
If your proposal contains links (e.g. to a calendar or a website), you can check whether the client clicked them.
You learn which elements draw the most attention, and you can build your next proposals around them.
You go into the conversation with something concrete: you refer directly to what interested the client.
The better you understand what interests your client, the more accurately you steer the conversation, and that translates directly into a better chance of closing the sale.
Session replay - the second new feature that gives you the full picture
Alongside the Heatmap, we're introducing Session replay (you could call it a recording of the client's visit to the proposal). It's a step-by-step playback of how the client browsed your proposal - in what order they opened pages, where they scrolled quickly, and where they slowed down. Importantly, you can see how the client moves their mouse across the proposal and what exactly they clicked, for example whether they used the link to your pricing or your website.
In the recording, the viewer's cursor is marked with a blue dot, so you can see precisely where the client directed their attention. And when they pause in one spot for longer, the cursor fades. That's a clear signal that something held their attention at that point.
While the Heatmap gives you a ready-made summary, Session replay shows the dynamics and the order, and that often reveals more than the final result alone. For instance, you can see that the client first jumped to the pricing, then went back to the beginning, and finally spent longer on the terms of cooperation. A pattern like that tells you a great deal about what matters most to them.
Where will you find the Heatmap and Session replay in Sellizer?
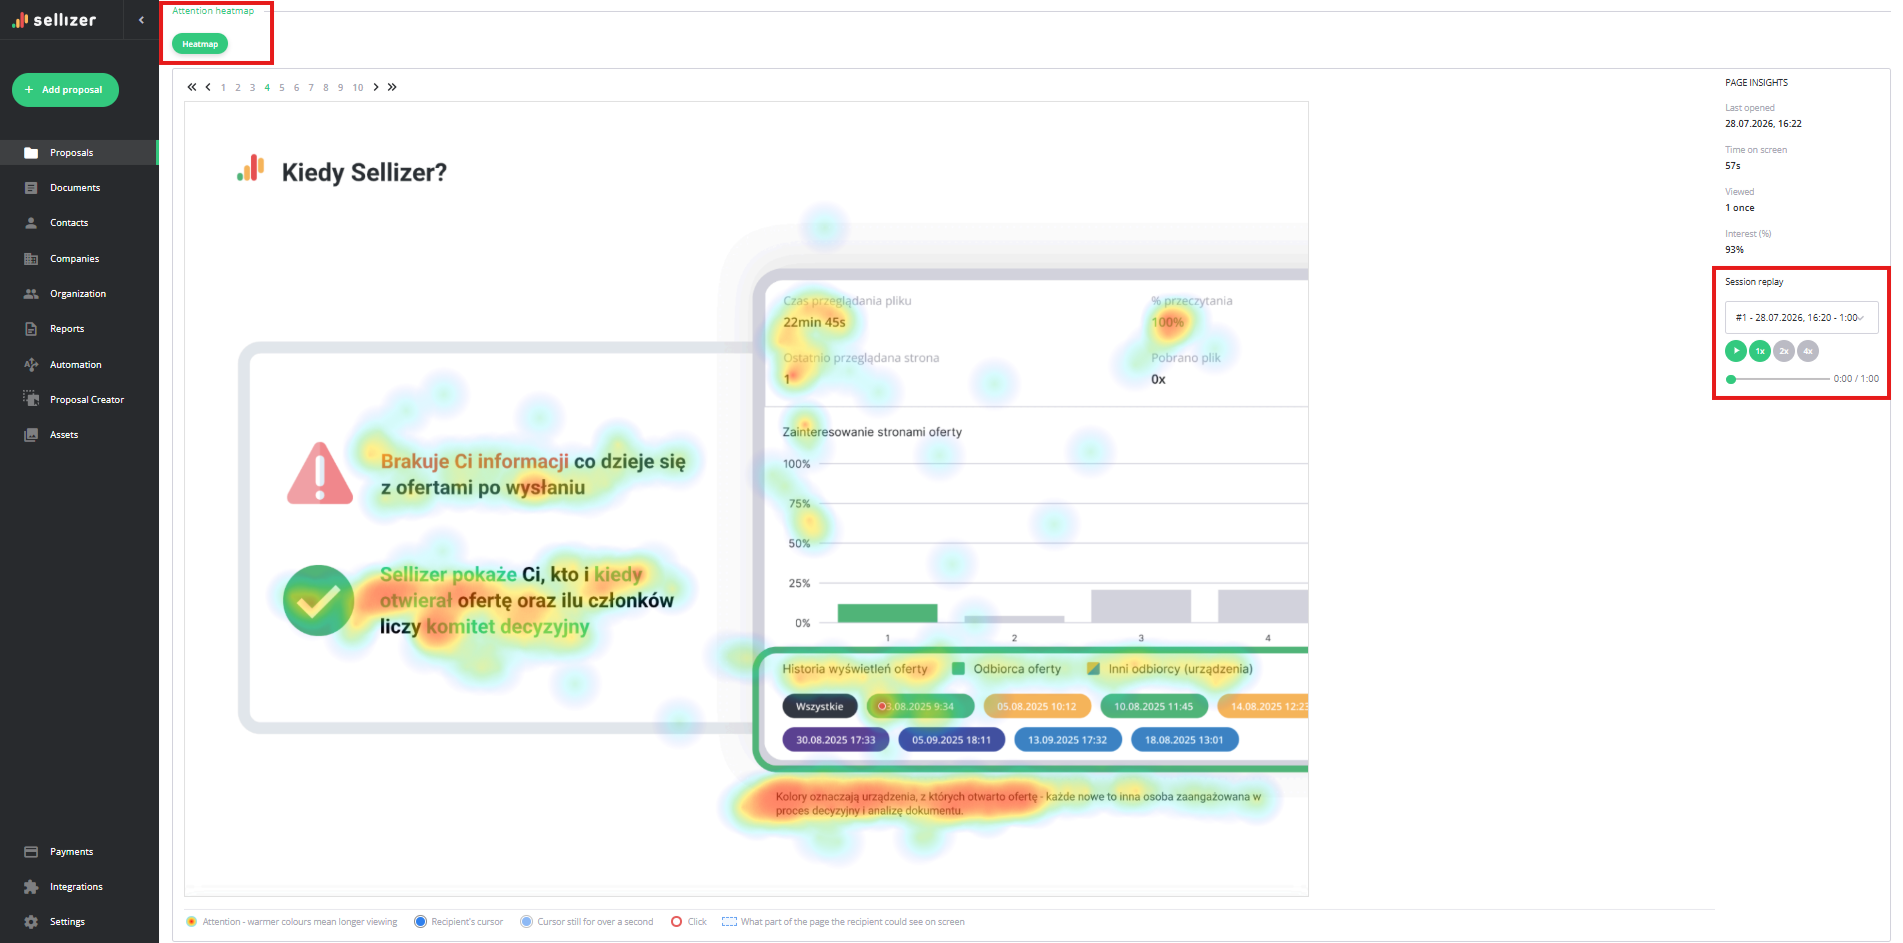
Both features are already available in the statistics of every sent proposal:
You go into the statistics of the chosen proposal.
Under the proposal's detailed statistics, you click the "Heatmap" button to lay the heatmap over the document - page by page.
You launch Session replay in the "Session replay" section, next to the Heatmap.
Everything is in one place, so a complete set of information about client behavior is always at hand.
What does this give you in a conversation with a client?
All of this knowledge comes down to one thing: you stop guessing and start acting on specifics. Instead of opening the conversation with a generic "Did you have a chance to look over the proposal?", you refer precisely to what interested the client.
Do you see that they analyzed the scope of services for a long time? Start right there. Did the client click the calendar link but not book a meeting? You have the perfect pretext to suggest a time. Did they skip a key section? You can gently circle back to it. This way you come across as someone who truly understands the client's needs and that builds trust faster than any sales script.
Statistics, Heatmap, and session recording - how do they differ?
Sellizer now gives you three complementary perspectives on what happens with a proposal after you send it. They're easy to confuse, so let's explain the difference:
View | Answers the question | What it shows |
Statistics | Whether and how much? | Whether the client opened the proposal, how many times, and how much time they spent on a given page |
Heatmap | Where? | Which fragments of the page the client concentrated on and what they clicked |
Session replay | How? | Step by step, how the client moved through the proposal and when they clicked something |
These aren't competing features, but three levels of zoom on the same situation. Statistics are the starting point, the Heatmap adds specifics, and Session replay - the full picture.
FAQ (ready-made questions and answers)
How do I read the colors on the Heatmap?
The warmer the color, the more attention the client gave to a given spot. Fragments they barely noticed stay cool (blue), while the ones where they lingered longest glow red.
How does the Heatmap differ from Session replay in Sellizer?
The Heatmap is a summary - an image showing where attention was focused overall on a given page. Session replay is a step-by-step playback of how the client moved through the proposal: how they steered the mouse and what they clicked. The Heatmap tells you where, and Session replay tells you how.
Do both features work on older proposals?
The new features collect data from the moment they were introduced - they don't work retroactively. But the proposal itself can be older: what matters is that someone opens it now. It's enough for a client to open your proposal (even one sent earlier) and you'll see the result.
Where do I find the Heatmap and Session replay in the Sellizer panel?
Both features are in the statistics of the chosen proposal: you turn on the Heatmap with the "Heatmap" button under the document's detailed statistics, and you launch the client's visit in the "Session replay" section - next to the Heatmap.
Why does Session replay sometimes differ from the statistics in Sellizer?
Statistics show the active time the client actually spent on the proposal - when they step away from the computer or switch tabs, the counter stops. Session replay, on the other hand, plays back the entire visit, breaks included, so it tends to be longer. Additionally, if the client sees several pages on screen at once (e.g. on a large monitor), the time in the statistics is distributed across those pages according to how much of each is visible - regardless of where they happen to be holding the cursor. So the recording shows where they moved the mouse, while the statistics show how their attention was spread across the pages.